+41 (0)79 334 00 93
 tobiaskisch@hotmail.com
R Tests

We build a linear regression below.
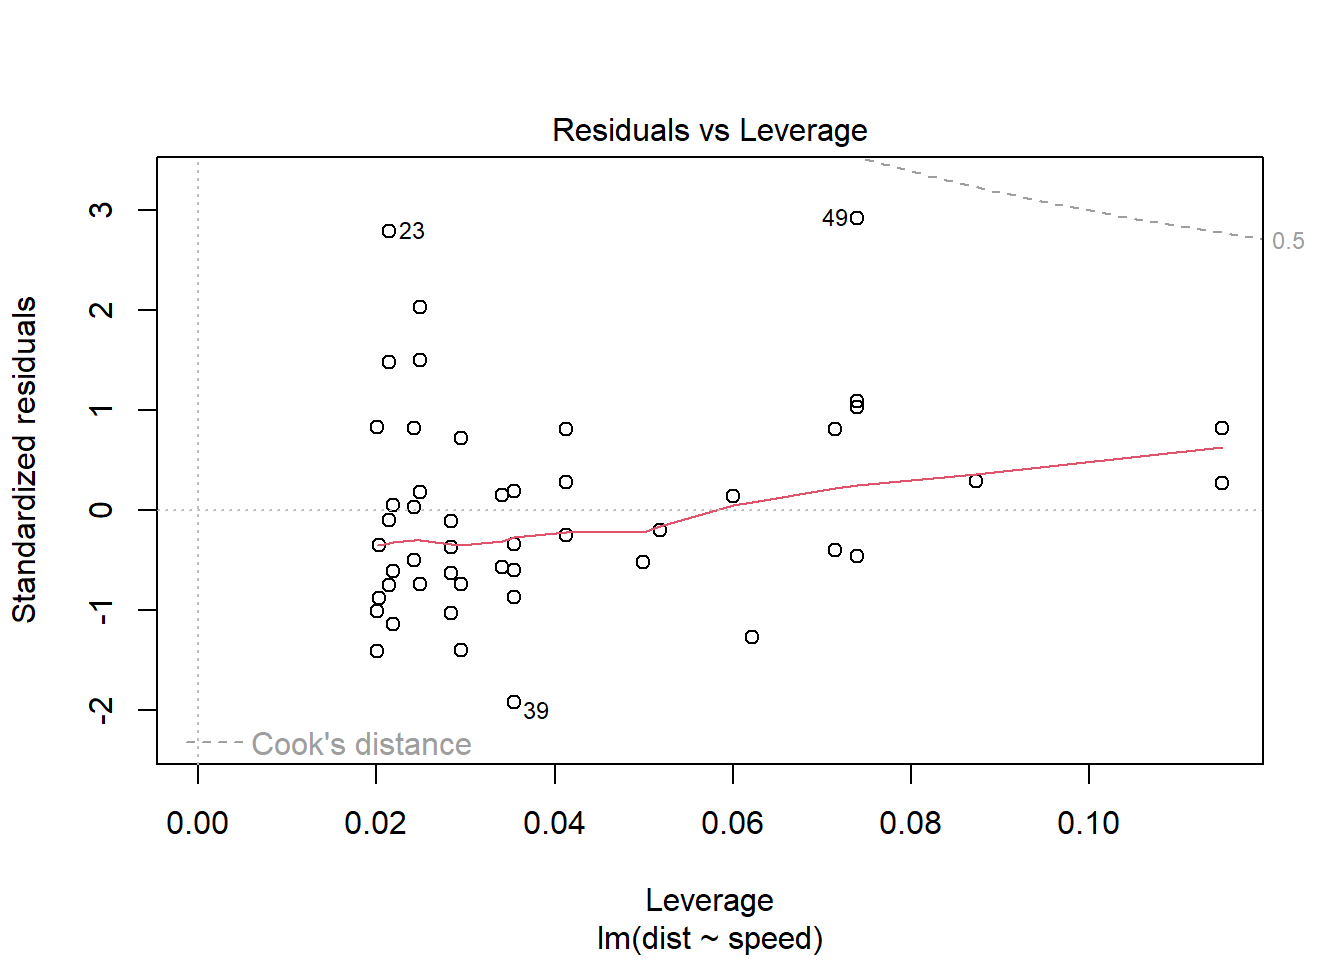
fit = lm(dist ~ speed, data = cars)
b = coef(summary(fit))
plot(fit)
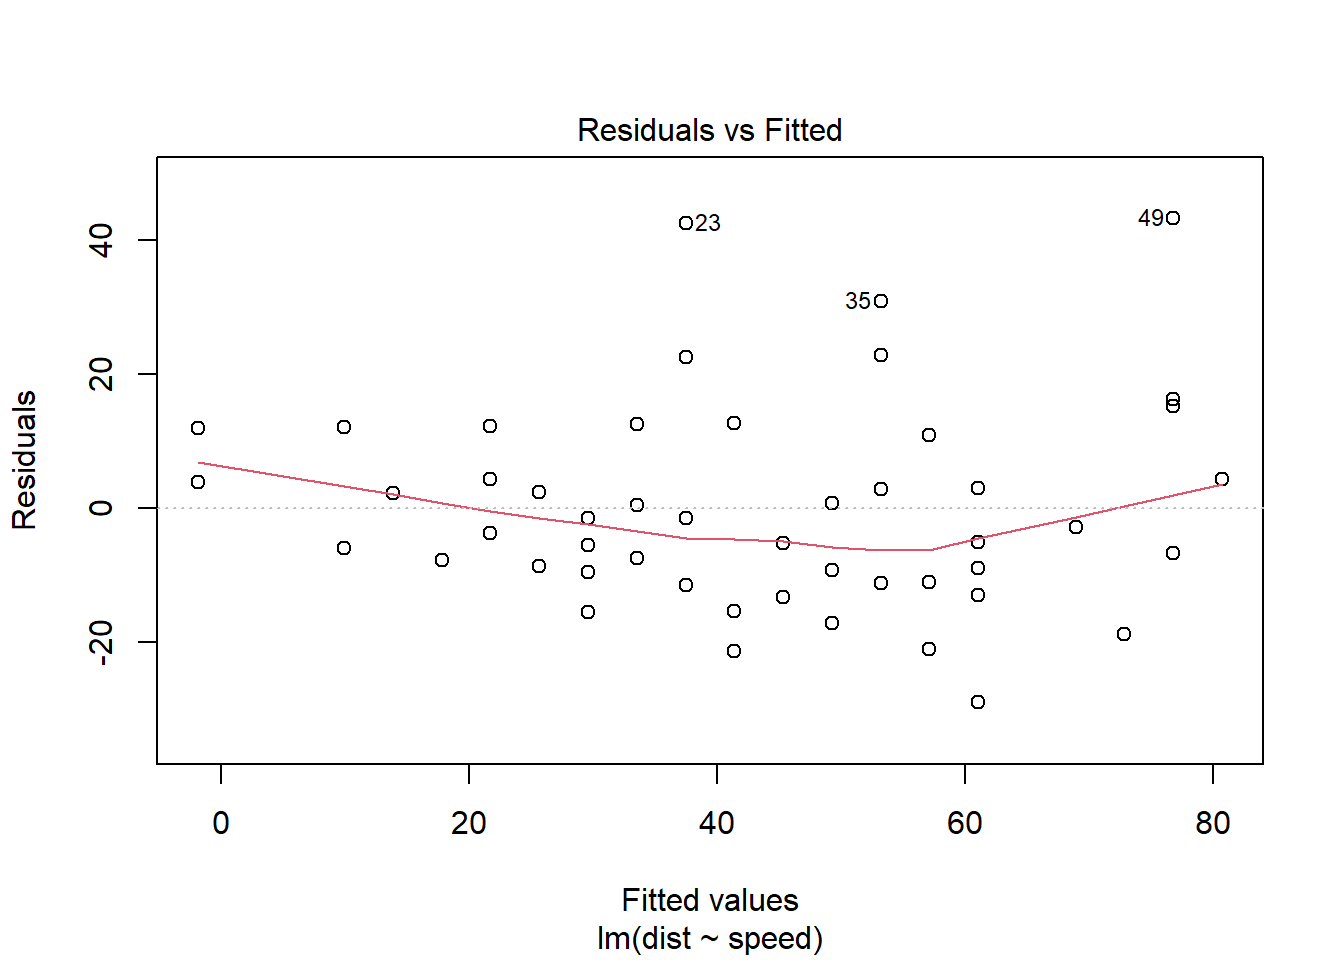
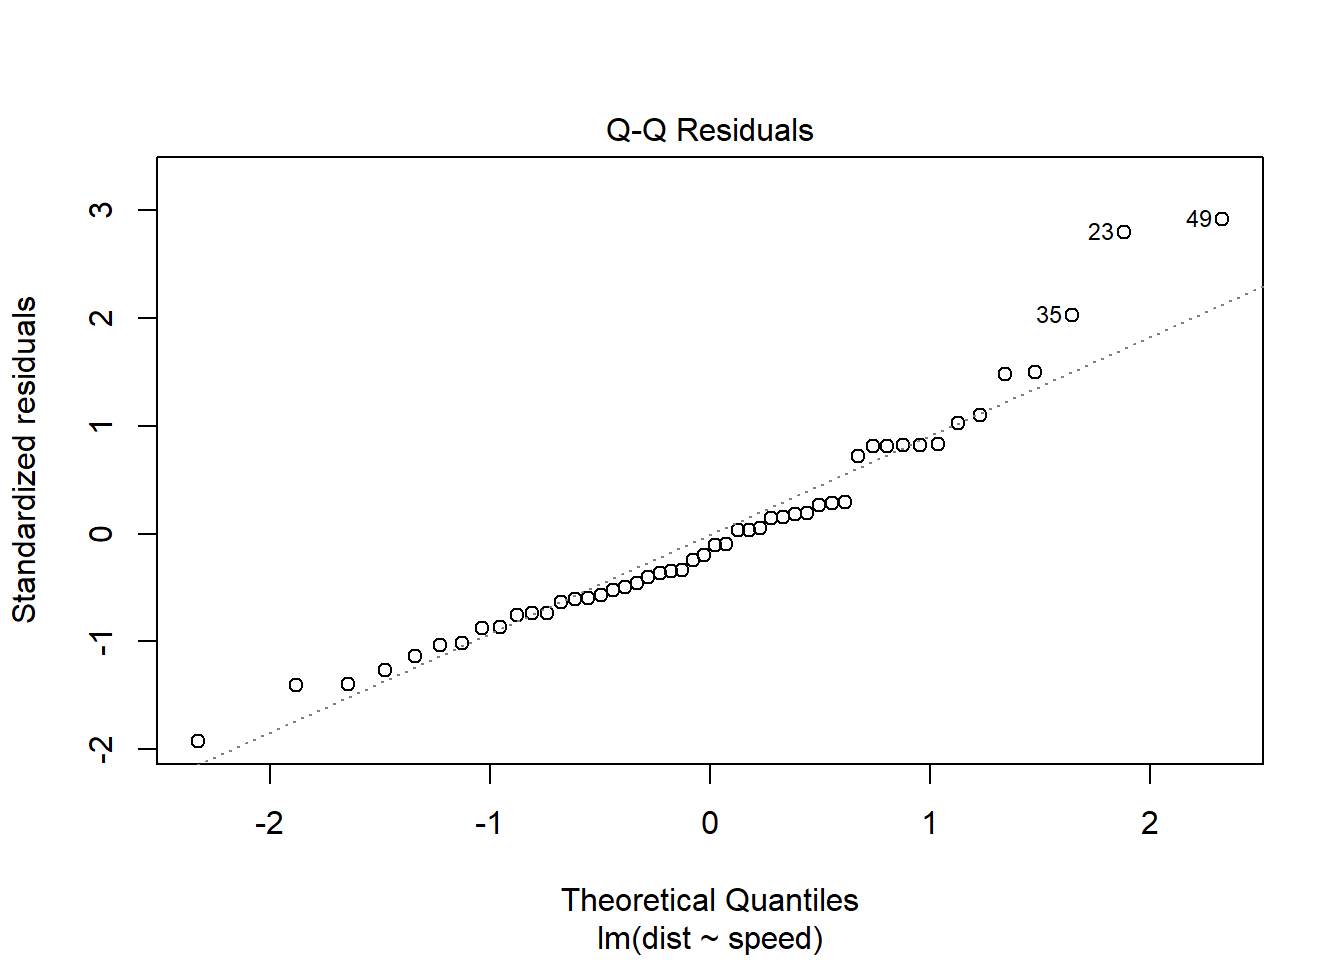
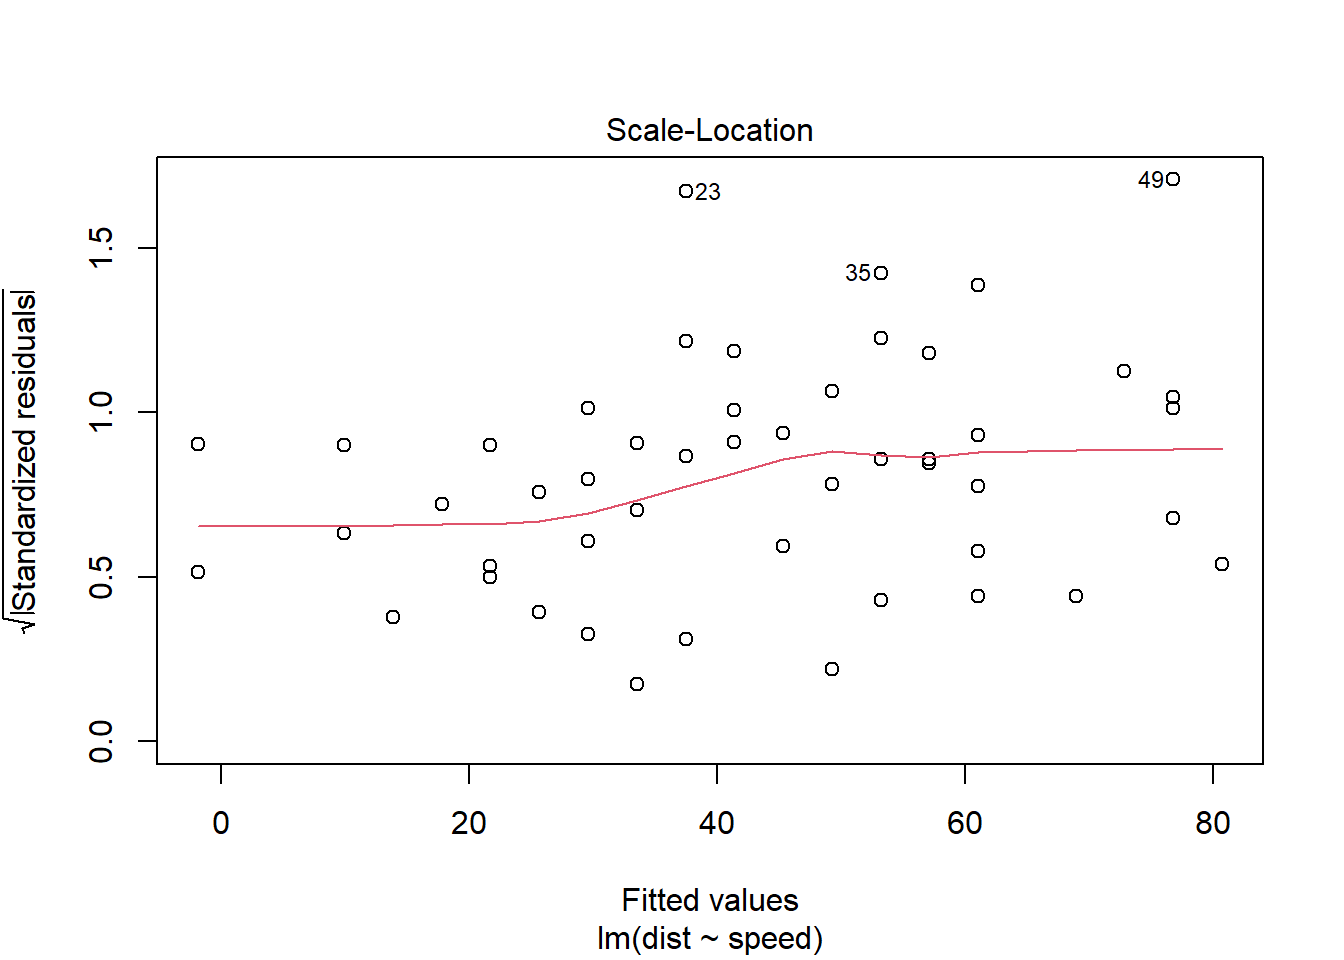
The slope of the regression is 3.9324088.
# library
library(ggplot2)
library(ggExtra)
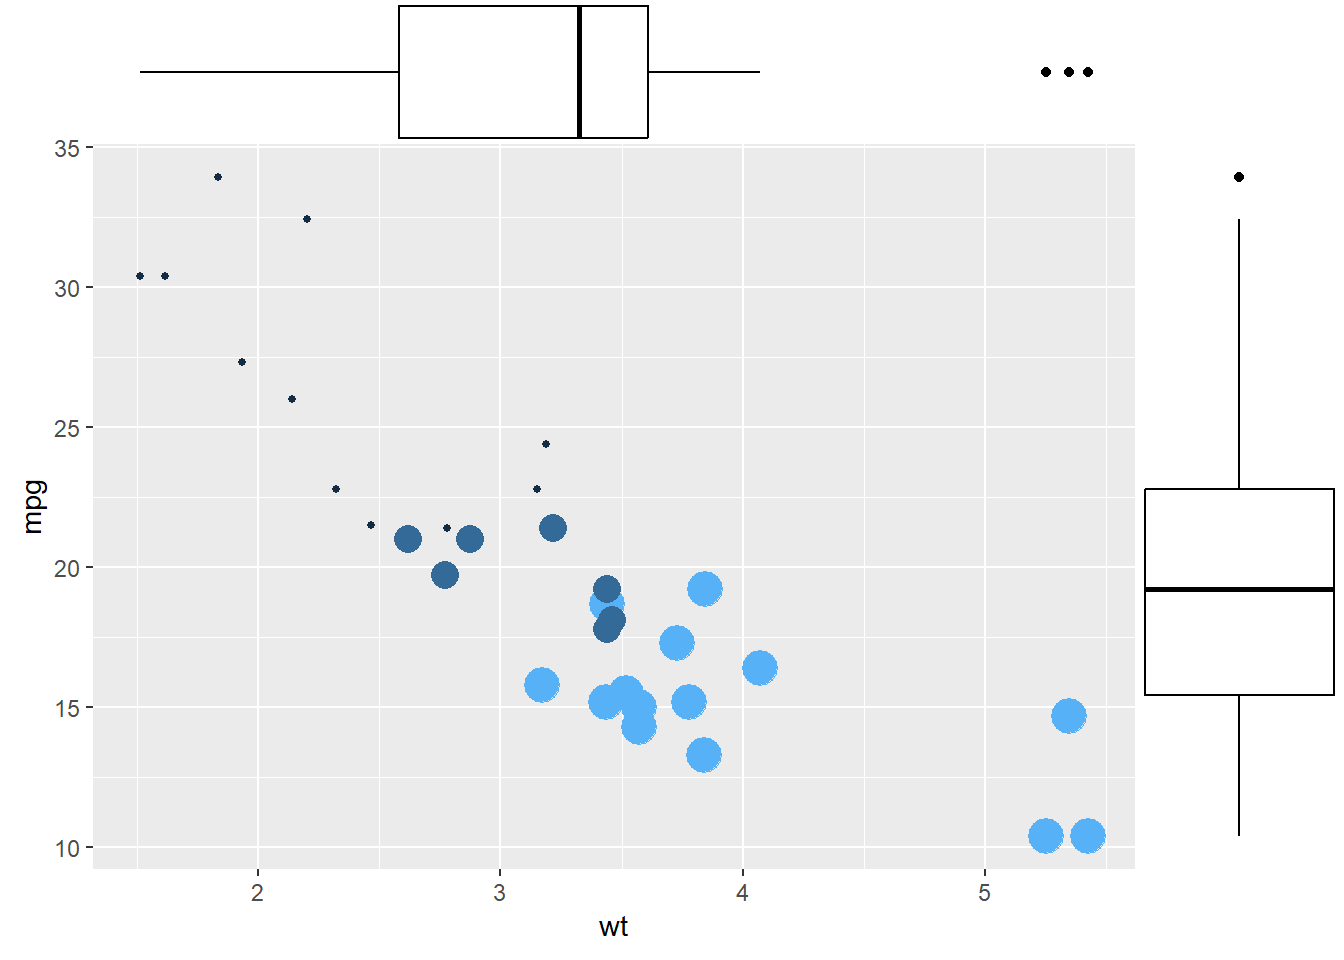
# The mtcars dataset is proposed in R
head(mtcars)
##                    mpg cyl disp  hp drat    wt  qsec vs am gear carb
## Mazda RX4         21.0   6  160 110 3.90 2.620 16.46  0  1    4    4
## Mazda RX4 Wag     21.0   6  160 110 3.90 2.875 17.02  0  1    4    4
## Datsun 710        22.8   4  108  93 3.85 2.320 18.61  1  1    4    1
## Hornet 4 Drive    21.4   6  258 110 3.08 3.215 19.44  1  0    3    1
## Hornet Sportabout 18.7   8  360 175 3.15 3.440 17.02  0  0    3    2
## Valiant           18.1   6  225 105 2.76 3.460 20.22  1  0    3    1
# classic plot :
p <- ggplot(mtcars, aes(x=wt, y=mpg, color=cyl, size=cyl)) +
      geom_point() +
      theme(legend.position="none")

# with marginal histogram
p1 <- ggMarginal(p, type="histogram")

# marginal density
p2 <- ggMarginal(p, type="density")

# marginal boxplot
p3 <- ggMarginal(p, type="boxplot")
p3